Virginia Medical Malpractice Insurance

Physicians who are new to Virginia may have a few questions about medical malpractice insurance in the state. Does the law require you to carry medical malpractice insurance in Virginia? What are the top insurance carriers? This guide to medical malpractice insurance in Virginia will provide you with the information you need to know.
Virginia Medical Malpractice Insurance Fast Facts
Below, you'll find answers to commonly asked questions about medical malpractice insurance in Virginia.
1. Does the Law Require You to Carry Malpractice Insurance in Virginia?
Virginia state laws do not require you to carry malpractice insurance. There also aren't any minimum requirements for having medical malpractice insurance in Virginia. Despite the lack of requirements for medical malpractice insurance, health care providers who hope to work in Virginia may still want to get malpractice insurance, which can protect you in the event of a malpractice lawsuit.
2. How Much Malpractice Insurance Do I Need in Virginia?
How much malpractice insurance you'll need in Virginia depends on your location and specialty. For example, you'll need more coverage if your practice area is higher-risk.
3. How Much Are Virginia Malpractice Insurance Rates?
Your malpractice insurance rates will depend on your county, specialty, history with claims and the amount of coverage you'll be carrying. By partnering with Gallagher, you'll receive access to the most competitive rates in the industry.
Tort Reform in Virginia
Virginia was among the first states to enact tort reform to help protect their physicians. During the nation's first malpractice insurance crisis, the Virginia General Assembly approved the Medical Malpractice Act of 1976, which limited damages to a maximum of $750,000. This law has helped create a stable malpractice insurance environment in Virginia for more than 40 years.
The Medical Malpractice Act of 1976 initially capped damages in a malpractice suit at $750,000. Lawmakers increased the cap to $1 million in 1983 and then again to $1.5 million in 1999, and included yearly increases of $50,000, which took the cap to $1.85 million in 2006. In 2007, the cap went up to $2 million, and remained at that level until 2012. Legislators set a $2,050,000 cap as of July 1, 2012, with annual increases of $50,000 each July 1 until 2031.
Lawyers have tested the cap several times in court, and it has held up each time. It also includes a $350,000 cap on punitive damages and the option for either party to request a medical malpractice review panel. The cap in Virginia limits the total payment, as opposed to the caps in many other states that only limit the non-economic damages (pain and suffering, physical and emotional distress, loss of enjoyment of life, etc).
While the insurance cap has stabilized the market, it has also protected physicians from any personal liability from malpractice insurance. Since there is a maximum cap for a lawsuit, Virginia physicians can insure 100% of their malpractice liability. In most other states, physicians carry a limit of $1 million per claim, but could be personally liable in the event the claim pays more than that amount in settlement or judgment. Since the per-claim limit follows the Virginia cap, Virginia physicians carry some of the highest malpractice limits in the nation. The most common limit for the remainder of U.S. physicians is $1 million per claim, with a $3 million policy aggregate. Physicians in Virginia carry a substantially higher per claim and policy aggregate limit as per yearly breakout below.

Top Carriers in Virginia
The following is a list of the top insurance carriers of medical malpractice insurance in Virginia:
- The Doctors Company
- Medical Mutual of Maryland
- Medical Protective
- Mag Mutual
- ProAssurance
Cap Limits by Year (source Virginia General Assembly Legislative information system)
- August 1, 1999, through June 30, 2000: $1.50 million
- July 1, 2000, through June 30, 2001: $1.55 million
- July 1, 2001, through June 30, 2002: $1.60 million
- July 1, 2002, through June 30, 2003: $1.65 million
- July 1, 2003, through June 30, 2004: $1.70 million
- July 1, 2004, through June 30, 2005: $1.75 million
- July 1, 2005, through June 30, 2006: $1.80 million
- July 1, 2006, through June 30, 2007: $1.85 million
- July 1, 2007, through June 30, 2008: $1.925 million
- July 1, 2008, through June 30, 2012: $2.00 million
- July 1, 2012, through June 30, 2013: $2.05 million
- July 1, 2013, through June 30, 2014: $2.10 million
- July 1, 2014, through June 30, 2015: $2.15 million
- July 1, 2015, through June 30, 2016: $2.20 million
- July 1, 2016, through June 30, 2017: $2.25 million
- July 1, 2017, through June 30, 2018: $2.30 million
- July 1, 2018, through June 30, 2019: $2.35 million
- July 1, 2019, through June 30, 2020: $2.40 million
- July 1, 2020, through June 30, 2021: $2.45 million
- July 1, 2021, through June 30, 2022: $2.50 million
- July 1, 2022, through June 30, 2023: $2.55 million
- July 1, 2023, through June 30, 2024: $2.60 million
- July 1, 2024, through June 30, 2025: $2.65 million
- July 1, 2025, through June 30, 2026: $2.70 million
- July 1, 2026, through June 30, 2027: $2.75 million
- July 1, 2027, through June 30, 2028: $2.80 million
- July 1, 2028, through June 30, 2029: $2.85 million
- July 1, 2029, through June 30, 2030: $2.90 million
- July 1, 2030, through June 30, 2031: $2.95 million
- July 1, 2031, and after: $3 million
Resource for Physicians in Virginia

While you may not need to carry medical malpractice insurance in Virginia, you may find your practice limited if you don't have coverage. Having medical malpractice insurance will give you a broader range of options for facilities to practice in and protect you in the event of a lawsuit. Learn more about our medical malpractice insurance, or request a quote from us at Gallagher.
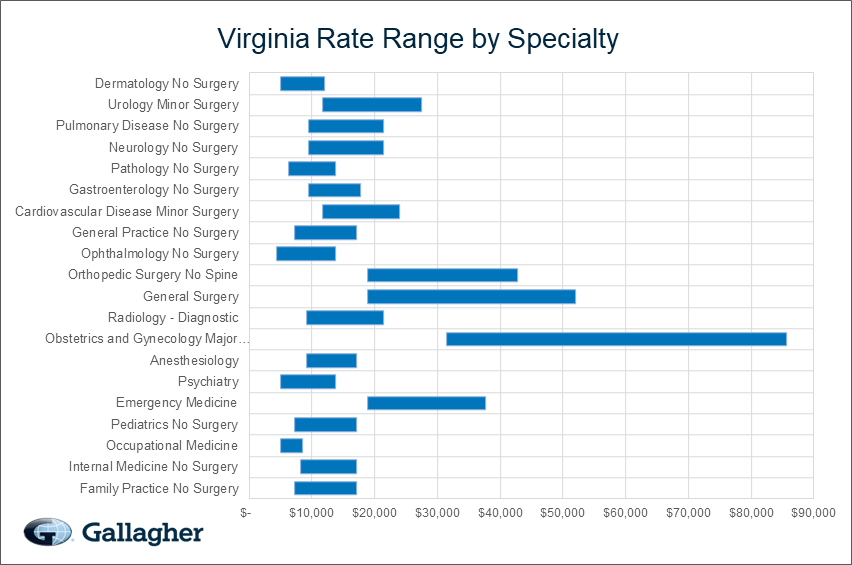
Virginia Medical Malpractice Insurance Rates By Specialty (Top 20)
Rates depend greatly on specialty. Physicians offering high-risk care, such as surgeons, have higher rates than doctors in lower-risk areas. Prices will vary, though, based on your claim history and location in addition to your specialty. Always talk to an insurance expert to get a more specific quote for your malpractice insurance.
Below are undiscounted state filed rate data averages across all territories for 1,000,000/3,000,000 limits.
| Specialty | Average Rate | Lowest Rate | Greatest Rate | Count |
|---|---|---|---|---|
| Family Practice No Surgery | $11,283 | $7,227 | $17,124 | 3,426 |
| Internal Medicine No Surgery | $12,035 | $8,124 | $17,124 | 2,865 |
| Occupational Medicine | $6,626 | $5,027 | $8,562 | 1,764 |
| Pediatrics No Surgery | $11,701 | $7,227 | $17,124 | 1,627 |
| Emergency Medicine | $27,912 | $18,854 | $37,673 | 1,274 |
| Psychiatry | $8,584 | $5,027 | $13,699 | 1,093 |
| Anesthesiology | $12,597 | $9,114 | $17,124 | 1,013 |
| Obstetrics and Gynecology Major Surgery | $57,153 | $31,424 | $85,620 | 993 |
| Radiology - Diagnostic | $14,626 | $9,114 | $21,405 | 907 |
| General Surgery | $40,066 | $18,854 | $52,012 | 636 |
| Orthopedic Surgery No Spine | $31,766 | $18,854 | $42,810 | 529 |
| Ophthalmology No Surgery | $7,880 | $4,400 | $13,699 | 494 |
| General Practice No Surgery | $11,283 | $7,227 | $17,124 | 480 |
| Cardiovascular Disease Minor Surgery | $16,829 | $11,714 | $23,974 | 463 |
| Gastroenterology No Surgery | $13,661 | $9,447 | $17,779 | 369 |
| Pathology No Surgery | $9,674 | $6,285 | $13,699 | 343 |
| Neurology No Surgery | $15,115 | $9,447 | $21,405 | 330 |
| Pulmonary Disease No Surgery | $15,115 | $9,447 | $21,405 | 318 |
| Urology Minor Surgery | $19,087 | $11,714 | $27,399 | 303 |
| Dermatology No Surgery | $7,944 | $5,027 | $11,987 | 271 |
* Please note that the above rates are state filed rates. It is not uncommon for Gallagher Healthcare clients to receive up to 50% or more in discounts from state filed rates. Please Request a Quote to receive a custom premium indication.
Rate Range by Specialty
This chart compares the range of possible state filed medical malpractice premium rates by admitted markets and a few Gallagher Select markets broken out by the top 20 specialties in Virginia.
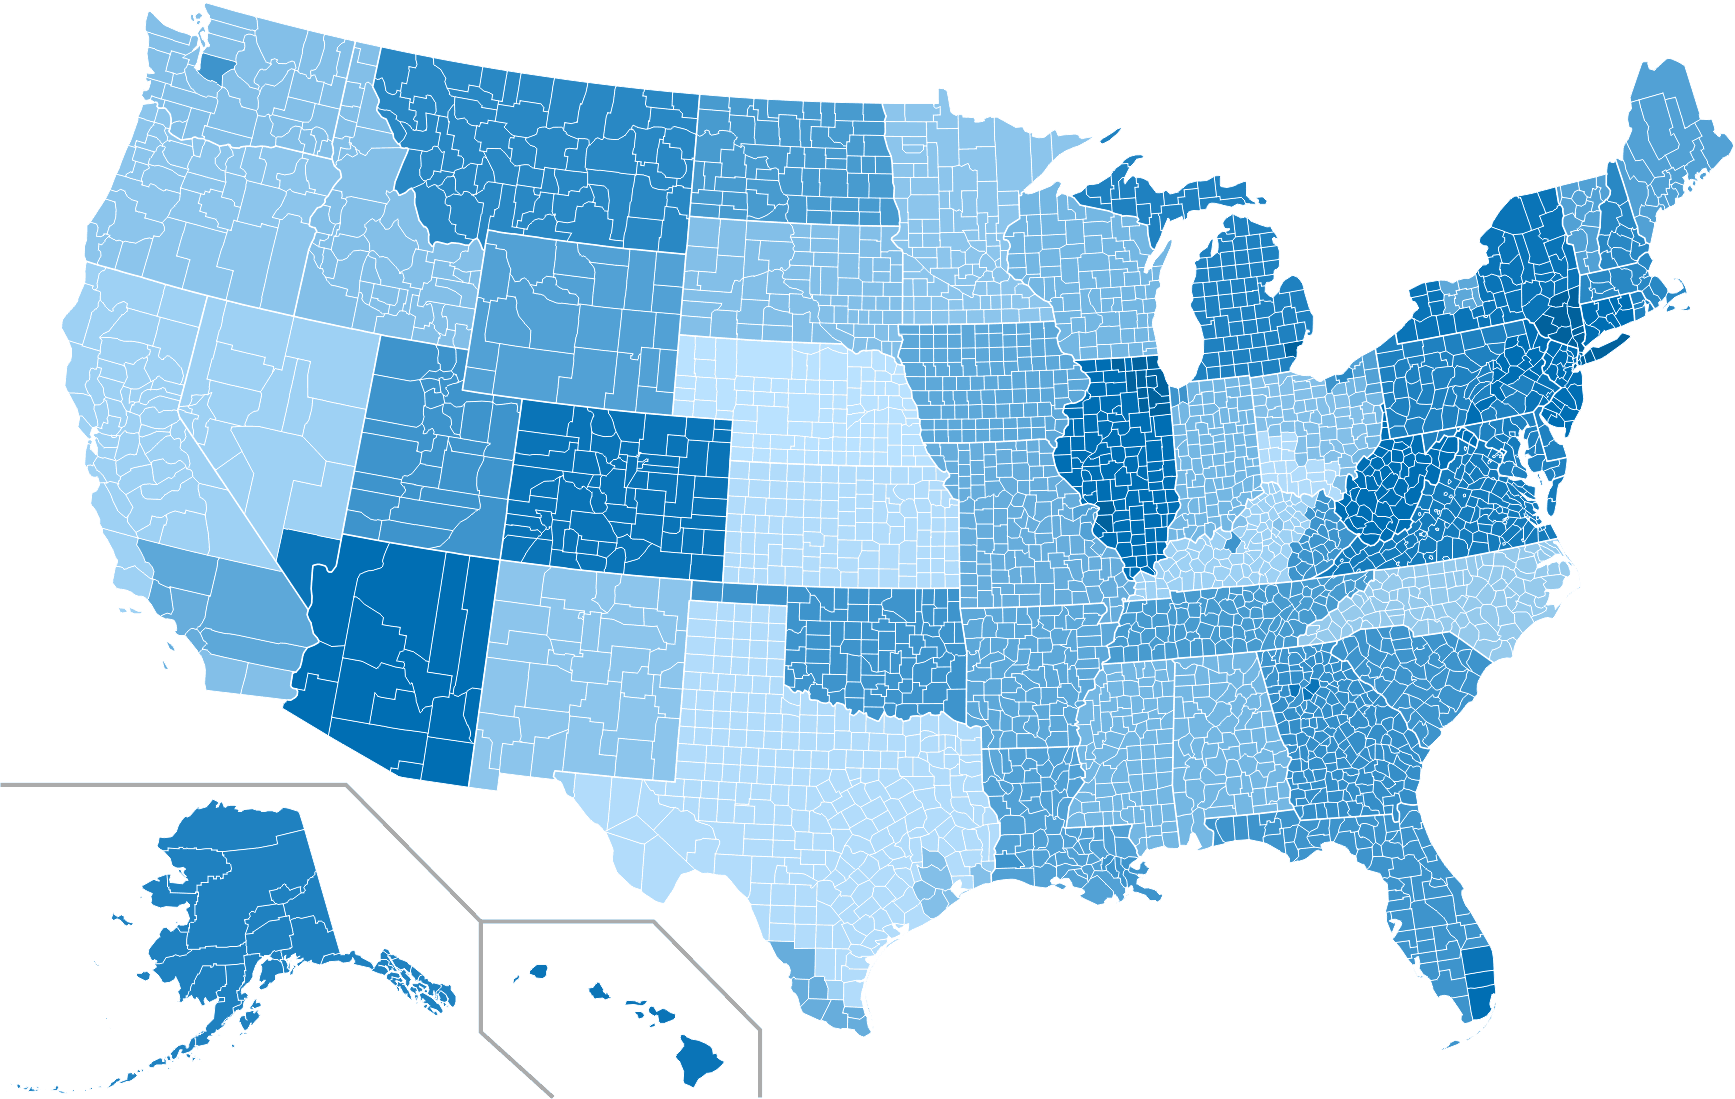
USA Ranking Map
The map below provides a visual display of the nation and compares what a typical primary care physician might pay compared to each individual state and county. This research is based on the average rate for a single specialty, the most common limits in that state, and the mature claims made premium. The darker the blue, the higher the average premium, see how Virginia compares to other states.
Premium savings is just one click away! Complete this form to receive your FREE, NO OBLIGATION medical malpractice insurance quote. You can also call us at 800.634.9513 and ask to speak to a salesperson.